This article appeared in the February 2020 issue of Property Investor News. To receive a sample copy visit www.property-investor-news.com. 4 February 2020
 As a professional investor, I’m often asked about where to invest. I enjoy having these conversations and sharing my views on the various asset classes which invariably include stockmarkets, property and P2P loans.
Regulatory reasons prevent me from providing specific advice to individuals so I would love to direct them to those that can. However, the problem with good investment advice is that it’s rare!
Take your average IFA. He/she generally makes a living by advising or managing money in liquid financial assets – i.e. equity and bond funds. Investing in other major asset classes such as Property, Crowdfunding, or P2P loans is rarely on the agenda. Why? Such investments are generally not well understood by IFAs. And, frankly, they don’t generate revenues.
On the other hand, a conversation with a property specialist about the stockmarket almost certainly leads to a concern about volatility and uncertainty.
What does the data show?
We know there is a scarcity of “whole of market”, truly unbiased investment guidance. Which is why looking at historical patterns can be a useful guide. History doesn’t repeat itself but often rhymes.
With that in mind, I was asked by Property Investor News to do some research on the main asset classes. How do they compare in terms of historical returns, risk and the effort required?
The majority of private investors will have interest in the following asset classes:
- Stocks. Including active funds, passive index funds, ETFs, individual stocks
- Property. Including residential single-lets and HMOs, commercial property and developments
- Secured Property Loans – passively investing in property projects for fixed returns (including P2P/Crowdfunding)
Readers should remember that all data shown is historical and should not be relied upon to make future investment decisions. Capital At Risk.
First, how am I invested?
Personally, I have exposure to all three of these asset classes. I own Stocks (mainly via passive Global ETFs), Direct Property (UK single lets and HMOs) and Secured Property Loans (first and second charge loans secured over residential property). The latter is a growing part of my portfolio for reasons that may become apparent below. But I will always remain diversified.
I believe in, and practice, diversification. Nobody has the ability to accurately predict how each asset class will perform over the next 1, 3 or 5 years. There are too many variables that include government policy, market volatility, recession risk, tax changes, global pandemics, interest rates etc. Uncertainty will always exist so diversification is the best risk mitigator.
To keep the article manageable, I compare historical returns and risks of the broad asset classes of Stocks (using FTSE 100), Direct Property (UK residential single-let BTLs) and Secured Property Loans (Shorter duration loans, backed by 1st charge security).
There are four major factors to compare across the asset classes:
- Returns: over the past 5 years (2014-19) for each asset class
- Risk: how returns have fluctuated over the last 5 years
- Risk-adjusted returns: comparing the two factors above
- Effort/Hassle factor: the effort required to invest and manage each asset class
Data sources and assumptions used to calculate the numbers:
Direct Property: Nationwide UK House Price Index (price index. Assumes property bought with cash. Assumes 5% gross yield, 3% operating yield on single let basis. UK-wide performance. No value-add. Assumes no refinancing. Excludes all taxes.
Direct Property (Leveraged): Nationwide UK House Price Index. Assuming a 67% LTV interest-only mortgage at 3% pa interest. Assumes single-let gross yield of 5% and operating yield of 3%. UK-wide market. No value-adds. Assumes no refinancing. Excludes all taxes.
Secured Property Loans: A published index, as a proxy, comprised of short duration secured loans over UK Property. Returns not reinvested/compounded. Excludes all taxes.
FTSE 100 Index: FTSE 100 Total Return Index. Dividends included. Excludes all taxes.
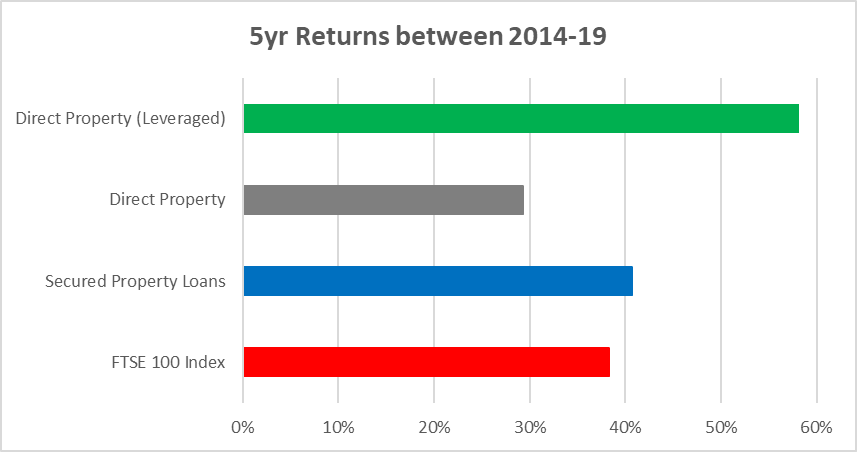
How do the 5-year returns compare?
The chart below compares returns over the last 5-year period (end-2014 to end-2019).
Direct Property (on a leveraged/mortgaged basis) performed the best at 58.2% over that 5-year period. As would be expected, in an up-market, leveraged property outperformed property bought without a mortgage.
Secured property Loans performed second best, returning 40.7% over the period.
What about Risk?
Simply looking at returns is not enough. Without a risk measure, the story is incomplete. We should always assess an investment’s returns (historic or expected returns) against its riskiness.
The chart below plots the same asset class returns against their riskiness, as defined by the volatility of their annual returns.
In a risk-return chart like below, we are seeking investments in the top-left area – i.e. those with low risk and high returns. We can’t always find this combination. In fact it’s very rare, almost a holy grail in the investment world.

Secured Property Loans is the clear winner on a risk/return basis. At around 8% pa, the asset class has delivered very consistent returns – year-in, year-out. Much of that is to do with the asset-backed security that comes with the investment – a “free insurance policy” that I often refer to.
This great combination of consistent returns, lower risk and security is why Secured Property Loans has been a growing part of my portfolio.
Direct Property (on a leveraged basis) gave the best returns but with higher volatility – much of that volatility occurring over the last 3 years with tax changes and political uncertainty.
Finally, stocks (measured by the FTSE 100) were the most volatile. This is partly due to the underperformance of the FTSE 100 versus global stocks. The latter outperformed, particularly due to Sterling’s weakness which had the effect of flattering global stock performance for UK-based investors.
For those who prefer a visual representation of risk, the chart below shows how returns have varied year-by-year, since 2014. It is from this data that the volatility number in the previous chart was calculated.
Two things stand out: the variability of annual returns of the FTSE 100 (red line) and the consistency of returns shown by Secured Property Loans (blue line).

Risk Perception – don’t fall for the clever marketing messages!
Talking of risk, my message to investors is to always be careful of a good story without first examining the cold facts such as security-backing (in the case of P2P loans). You may be faced by a persuasive marketing message or a “credible” promoter with a carefully crafted image. But it’s critical to weigh up the expected returns with a solid (and independent) evaluation of risk. The latter can only be done by undertaking analysis and due diligence of the opportunity – whilst avoiding a simple placement of trust in someone who sounds credible.
Don’t let the promoter influence your risk perception – they clearly have a vested interest in making riskiness appear lower versus reality!
It also works the other way. In 2009, in the midst of the global financial crisis, global stockmarkets plummeted to their lows. The S&P 500 dropped to 666 (it’s now trading at around 3,300). At the lows, valuation ratios such as Price/Book multiples implied that in 91% of previous instances at those ratio levels, stocks had returned at least 100% every time they got so low. So the probability of further declines was small compared to gains. Yet people continued to throw in the towel! Why? In this case, media headlines were determining the riskiness of stocks when the cold facts said the market was a screaming (low-risk) buy. In this situation, the media was making riskiness appear higher versus reality!
What about effort – the hassle factor?
I also measured returns versus a hassle factor. Hassle – or the effort required – is a subjective measure ranging from 1-10 about the effort involved in investing and managing each asset class. The chart below captures return vs hassle.

On this combination, investing in the stockmarket scores best. Investing in stocks – particularly diversified index funds or ETFs – is as passive as it gets. You find a good platform, invest your money, and monitor occasionally. There is a lot of evidence supporting a buy and hold strategy, as opposed to attempting to trade in at the lows and out at the highs. Most professionals are bad at the latter and I don’t recommend it to anyone.
Secured Property Loans generated slightly higher returns but involves a little more effort due to the need for due diligence in selecting the right opportunities. Once the DD and selection has been done, the actual investment process can be very simple – particularly via P2P platforms. Investors are welcome to download a free DD checklist from www.InvestLikeAPro.co.uk that helps make due diligence easier and more effective.
Investing into property clearly involves more hassle and the scores reflect that. In the chart I have not distinguished between single lets, HMOs, developments etc. Clearly, they vary on effort but they all require a protracted purchase process, mortgage applications, tenant management, maintenance, and accounting/tax.
And the winner is …. All of them!
I then put together a portfolio of the three (excluding unleveraged direct property). The chart below shows how a diversified portfolio (black dot in chart below) compares to individual assets. It showed the second highest returns with lower than average riskiness.

The diversified portfolio is created with an equal weighting (33%) in each of: Direct UK Property (leveraged), FTSE 100 index and Secured Property Loans.
What’s interesting is when we combine different risks into a portfolio, the net result for the whole portfolio is lower risk, overall. That is the magic of diversification: the risk of the whole is lower than the sum of parts. The geeks amongst you can learn more about how this works by searching “Capital Asset Pricing Model”.
More importantly, going forward, it helps mitigate the unknowns. Investments all behave differently. Some provide capital appreciation, some income. Certain investments will be more volatile than others. Some are liquid, some are not. Some have asset-backed security, some do not. Diversification helps reduce overall volatility and generate smoother returns.
Concluding Analysis
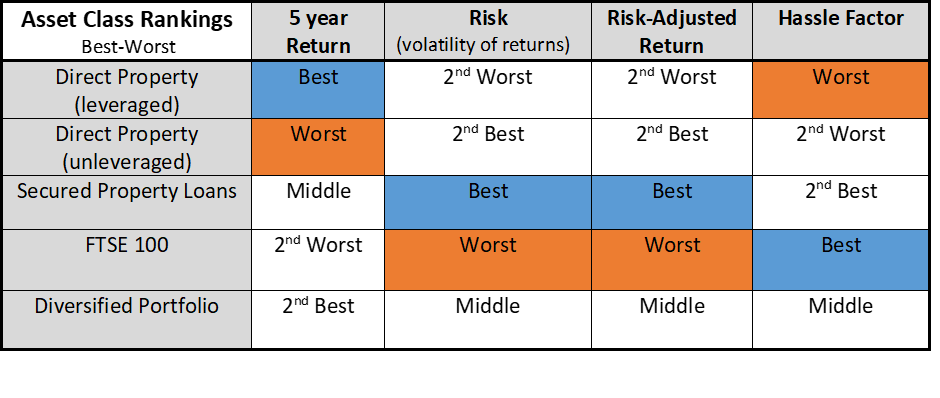 The table above summarises each of the asset classes, including the diversified portfolio, and how each ranks on the various factors. Investors can reach their own conclusions on each asset class and may wish to consider ones they currently don’t have exposure to.
Personally, I remain committed to my diversified portfolio for future risk mitigation and easy sleeping!
Manish Kataria
Readers should remember that all data shown is historical and should not be relied upon to make future investment decisions. Capital At Risk.
Join our Investor Circle to receive insights, resources and education – free and exclusive to members.
You’ll be the first to receive new investment insights and helpful ideas on how to build your capital and invest like a pro. All in a risk-managed and diversified manner.
Sign up at www.investlikeapro.co.uk
Manish Kataria CFA is a professional investor with 18 years’ experience in UK real estate and equity portfolio management. He has managed money for JPMorgan and other blue chip investment houses. Within real estate, he invests in and owns a range of UK property including developments, HMOs, serviced accommodation and BTLs.
")